

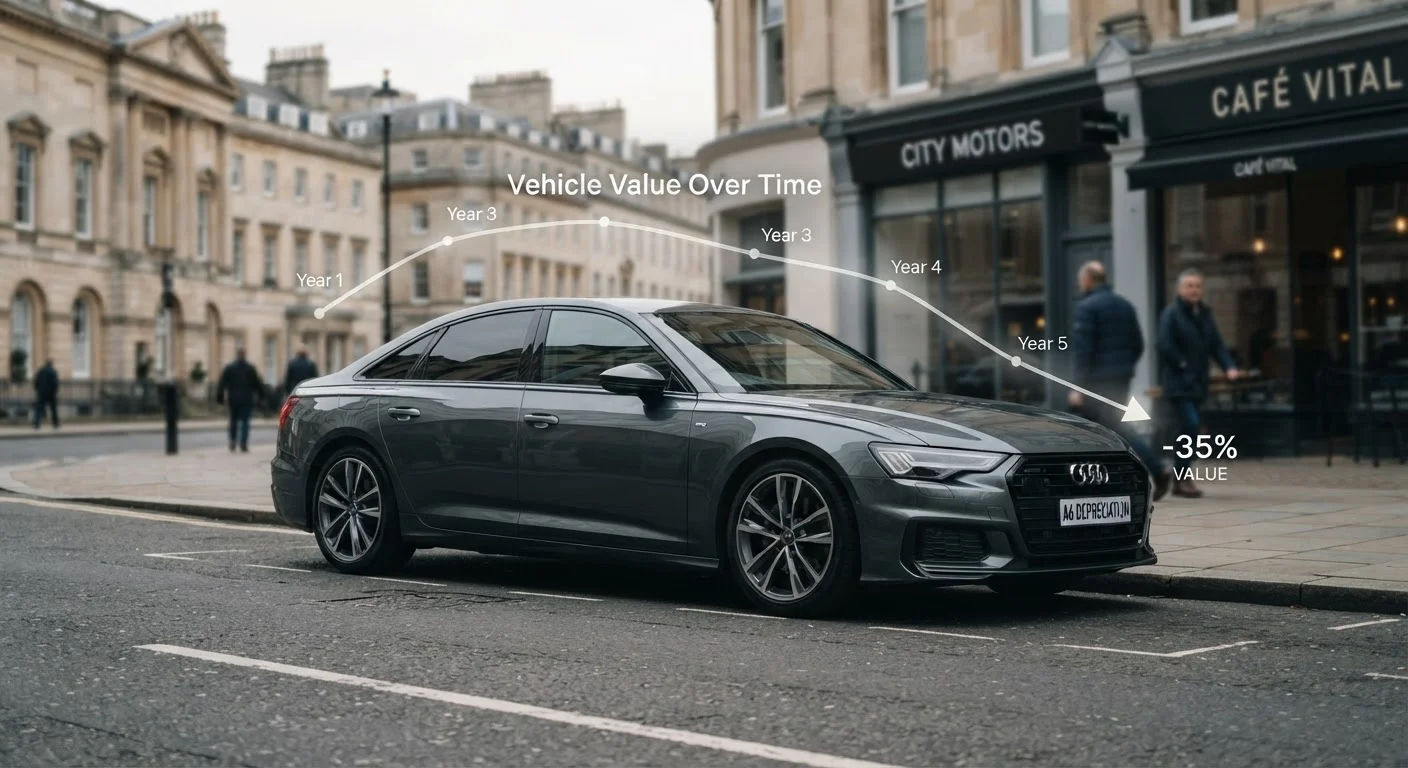
The Depreciation Curve: What It Actually Looks Like
If you plotted a typical vehicle's value against time on a graph, the resulting curve would not be a straight diagonal line. Instead, it would fall sharply at first, then flatten into a gentler slope. The steepest portion of that curve is concentrated in the earliest years of ownership - a fact that surprises many first-time buyers.
Here's how the curve generally breaks down for a new vehicle:
- Year 1: A drop of roughly 15-25% from original purchase price.
- Years 2-3: An additional 10-15% per year is common.
- Years 4-5: Losses continue but moderate, often 8-12% annually.
- Years 6-10+: Depreciation slows considerably, with modest annual losses.
By the five-year mark, many vehicles have lost 40-60% of their original value. This front-loaded loss structure has major implications for anyone comparing the true cost of buying new versus used - a topic explored in depth in our guide to hidden costs of car ownership.
15-25%
Average first-year value loss for new vehicles
Industry data consistently shows that the transition from new to used status drives the largest single-year depreciation event for most vehicles.
~50%
Typical value remaining after five years
Many vehicles retain approximately 40-60% of their original value at the five-year mark, depending on make, model, mileage, and market demand.
12,000-15,000
Average annual miles driven in the U.S.
The U.S. Federal Highway Administration estimates the average American driver covers roughly 12,000-15,000 miles per year; exceeding this benchmark accelerates depreciation.
Why the Drop Hits Hardest Early On
The sharp early depreciation is not arbitrary - it reflects how buyers and lenders perceive risk and desirability as a car ages.
The single largest depreciation event is the moment a new car leaves the lot. At that point, it is legally and commercially a "used" vehicle, even if it has zero miles driven. The manufacturer's suggested retail price reflects new-car packaging, warranty coverage, and the appeal of being the first owner. Once that status disappears, so does a portion of the premium buyers paid for it.
Beyond that initial drop, early depreciation is driven by several compounding factors:
- Warranty erosion: As the factory bumper-to-bumper warranty approaches its end, buyers are less willing to pay a premium.
- New model releases: Automakers update or refresh models regularly, making prior-year versions feel dated faster.
- Accumulated wear: Even light use adds mileage and cosmetic wear that buyers factor into offers.
Gap Insurance and Early Depreciation
Because new vehicles lose value so quickly in the first year or two, drivers who financed a new car may briefly owe more on their loan than the car is currently worth - a situation called being 'underwater' or having negative equity. Gap insurance is designed to cover this difference in the event of a total loss. It's worth evaluating whether this coverage makes sense during the steepest part of the depreciation curve.
Understanding why early depreciation is so steep can also influence decisions around gap insurance and loan terms - areas covered in our overview of how car insurance premiums are calculated.
Factors That Accelerate or Slow Depreciation
Not all vehicles follow the same depreciation curve. Several controllable and uncontrollable factors push values up or down relative to average.
Factors That Speed Up Depreciation
- Above-average mileage: The U.S. average is roughly 12,000-15,000 miles per year. Vehicles significantly above this threshold lose value faster.
- Poor maintenance history: Missing service records or deferred repairs raise red flags for buyers and appraisers alike.
- Unusual exterior colors: Niche colors narrow the buyer pool, reducing demand and resale prices.
- Low-demand vehicle segments: Sedans have faced faster depreciation than trucks and SUVs in the U.S. market in recent years, largely reflecting shifting consumer preferences.
Factors That Slow Depreciation
- Consistent, documented maintenance: Service records provide verifiable proof of care. Our maintenance schedule explainer outlines what to track and when.
- Low mileage relative to age: Fewer miles signal less mechanical wear, which buyers value.
- High-demand body styles and trims: Trucks, SUVs, and well-equipped trim levels typically hold value better in the U.S.
- Strong brand reliability reputation: Models from brands with consistent reliability ratings historically retain value longer.
Owners approaching high-mileage thresholds can also consult our guide on high-mileage vehicle upkeep to understand how maintenance priorities shift - and how staying ahead of wear affects long-term value.
Using Depreciation to Make Smarter Ownership Decisions
Knowing how depreciation works gives owners a clearer picture of when buying, holding, or selling makes financial sense. Buying a vehicle that is two to three years old, for example, lets a new owner avoid the steepest part of the curve while still getting a relatively modern, well-warranted vehicle.
For current owners, the depreciation curve affects decisions about when to trade in, how much to invest in repairs on an aging vehicle, and whether comprehensive insurance coverage still makes economic sense relative to the car's current market value. Skipping these calculations is one of several costly ownership decisions that seem reasonable at the time.
Depreciation is also a key chapter in the broader story of vehicle ownership from purchase to final sale, which is covered in full in The Complete Guide to Managing Your Vehicle Through Its Full Lifecycle.
The curve is not something owners can stop - but understanding its shape clearly is the first step toward making ownership decisions that reflect what the vehicle is actually worth at every stage.
Frequently Asked Questions
Most new vehicles lose between 15% and 25% of their purchase price within the first 12 months. This drop happens largely because the car transitions from "new" to "used" status, instantly affecting its resale market. The exact percentage varies by make, model, and market conditions.
Generally, yes - higher annual mileage accelerates depreciation because it signals greater wear on mechanical systems. However, a well-maintained high-mileage vehicle can retain more value than a low-mileage car in poor condition. Buyers weigh both factors together.
Electric vehicles (EVs) can follow different depreciation patterns, influenced by battery technology improvements, government incentives, and shifting consumer demand. Some EV models have depreciated faster than comparable gas vehicles, though this varies widely by brand and market.
Popular option packages, neutral exterior colors, lower mileage, a clean service history, and strong brand reputation all tend to support resale value. Vehicles in high-demand segments - such as trucks and SUVs in the U.S. market - also tend to hold value better than less popular body styles.
Depreciation typically slows significantly after the five-year mark and levels off further around years seven to ten. At that stage, annual value loss is relatively modest compared to the steep early years, though the car's total value is already substantially reduced.
Yes. A documented service history reassures buyers that the vehicle was properly cared for, which can command a higher resale price. Deferred maintenance, visible wear, and mechanical issues all reduce a car's market value more quickly. See our <a href="/autos-vehicles/car-maintenance/your-cars-maintenance-schedule-decoded">maintenance schedule guide</a> for more on staying on track.
The content on this site is provided for informational purposes only and should not be considered a substitute for professional advice. While we strive to provide accurate and up-to-date information, we make no guarantees regarding its completeness or accuracy. Always consult a qualified professional for advice specific to your circumstances before making any decisions.